Graphical Peak Discharge Method
The graphical peak discharge method was developed from hydrograph analyses using
TR-20 program. The peak discharge equation used is:

Equation 1: SCS Graphical peak discharge equation
Where:
qp=peak discharge(cfs)
qu=unit peak discharge (csm/in or cfs per sq.mile of drainage area per inch of runoff)
Am=drainage area (mi2)
Q=runoff (in)
Fp=pond and swamp adjustment factor.
Procedure
- Find out the initial abstraction for the rainfall amount, P, using the
table provided below or using the formula S=[(1000/CN)-10] with Ia=0.2S.
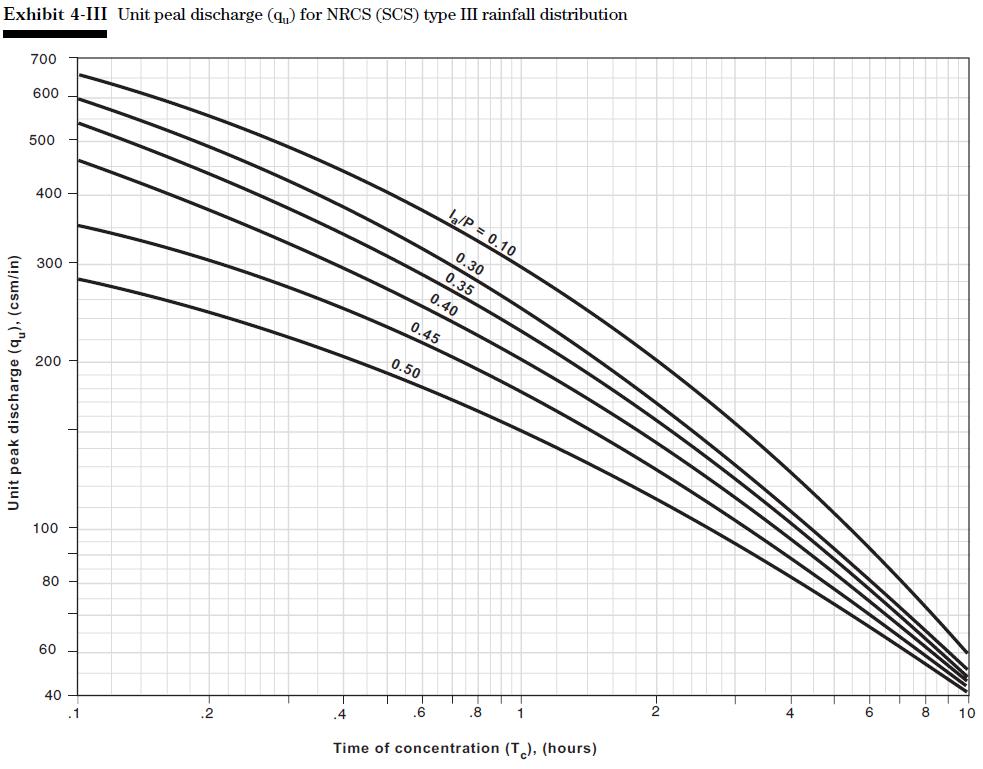
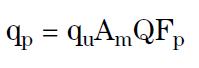
- Then depending on your region of study, use one of the
exhibit for either Type I, IA, II or III rainfall distribution for the time of
concentration of your drainage area. This will give you Unit Peak Discharge.
- Then use the Equation 1 to compute the peak discharge in cfs.
- Done !!
Table for estimating Ia for given CN
| Curve Number | Ia (in) | Curve Number | Ia (in) |
|---|---|---|---|
| 40 | 3 | 69 | 0.899 |
| 41 | 2.878 | 70 | 0.857 |
| 42 | 2.762 | 71 | 0.817 |
| 43 | 2.651 | 72 | 0.778 |
| 44 | 2.545 | 73 | 0.74 |
| 45 | 2.444 | 74 | 0.703 |
| 46 | 2.348 | 75 | 0.667 |
| 47 | 2.255 | 76 | 0.632 |
| 48 | 2.167 | 77 | 0.597 |
| 49 | 2.082 | 78 | 0.564 |
| 50 | 2 | 79 | 0.532 |
| 51 | 1.922 | 80 | 0.5 |
| 52 | 1.846 | 81 | 0.469 |
| 53 | 1.774 | 82 | 0.439 |
| 54 | 1.704 | 83 | 0.41 |
| 55 | 1.636 | 84 | 0.381 |
| 56 | 1.571 | 85 | 0.353 |
| 57 | 1.509 | 86 | 0.326 |
| 58 | 1.448 | 87 | 0.299 |
| 59 | 1.39 | 88 | 0.273 |
| 60 | 1.333 | 89 | 0.247 |
| 61 | 1.279 | 90 | 0.222 |
| 62 | 1.226 | 91 | 0.198 |
| 63 | 1.175 | 92 | 0.174 |
| 64 | 1.125 | 93 | 0.151 |
| 65 | 1.077 | 94 | 0.128 |
| 66 | 1.03 | 95 | 0.105 |
| 67 | 0.985 | 96 | 0.083 |
| 68 | 0.941 | 97 | 0.062 |
| 98 | 0.041 |
Limitations
Following limitations should be considered when using SCS graphical peak discharge method for estimating peak flows:
- Graphical method provides a determination of peak discharge only. This method cannot be used if you need a hydrograph or if the watershed subdivision is required
- The watershed must be hydrologically homogeneous, that is, describable by one CN. Land use,
soils, and cover are distributed uniformly throughout the watershed.
- The watershed may have only one main stream or, if more than one, the branches must have nearly
equal Tc' s.
- The method cannot perform valley or reservoir routing.
- The Fp factor can be applied only for ponds or swamps that are not in the Tc flow path.
- Accuracy of peak discharge estimated by this method will be reduced if Ia / P values are used that
are outside the range given in exhibit 4. The limiting Ia / P values are recommended for use.
- This method should be used only if the weighted CN is greater than 40.
Exhibit 4-I from chapter 4 of TR-55 for Type I rainfall Distribution

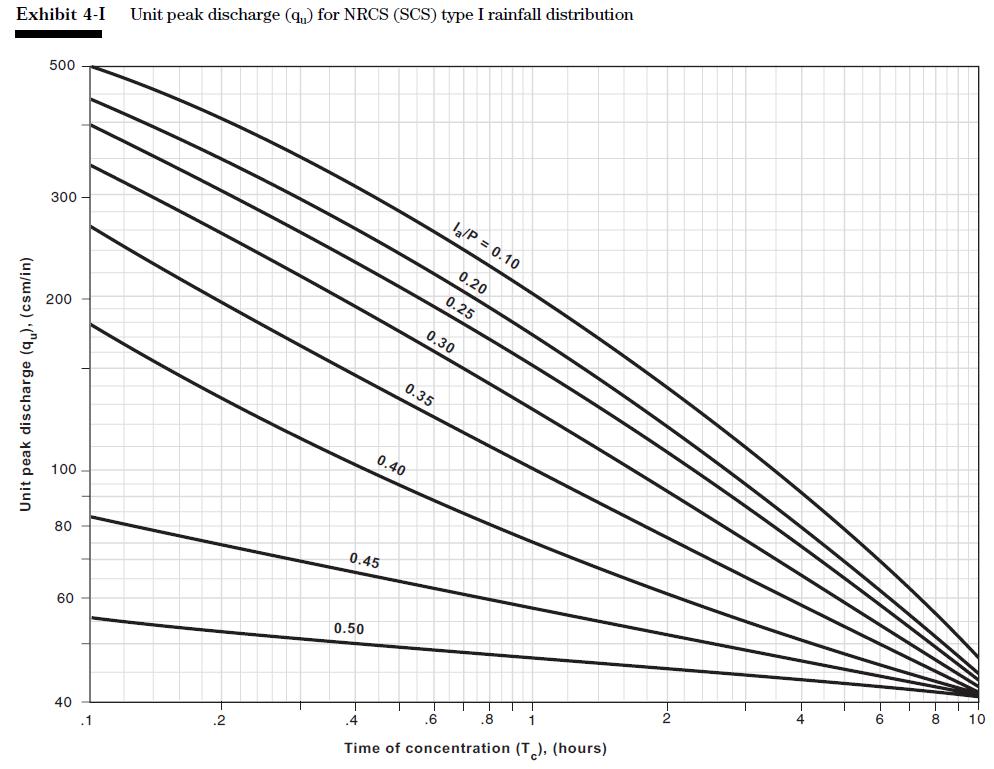
Exhibit 4-IA from chapter 4 of TR-55 for Type IA rainfall Distribution

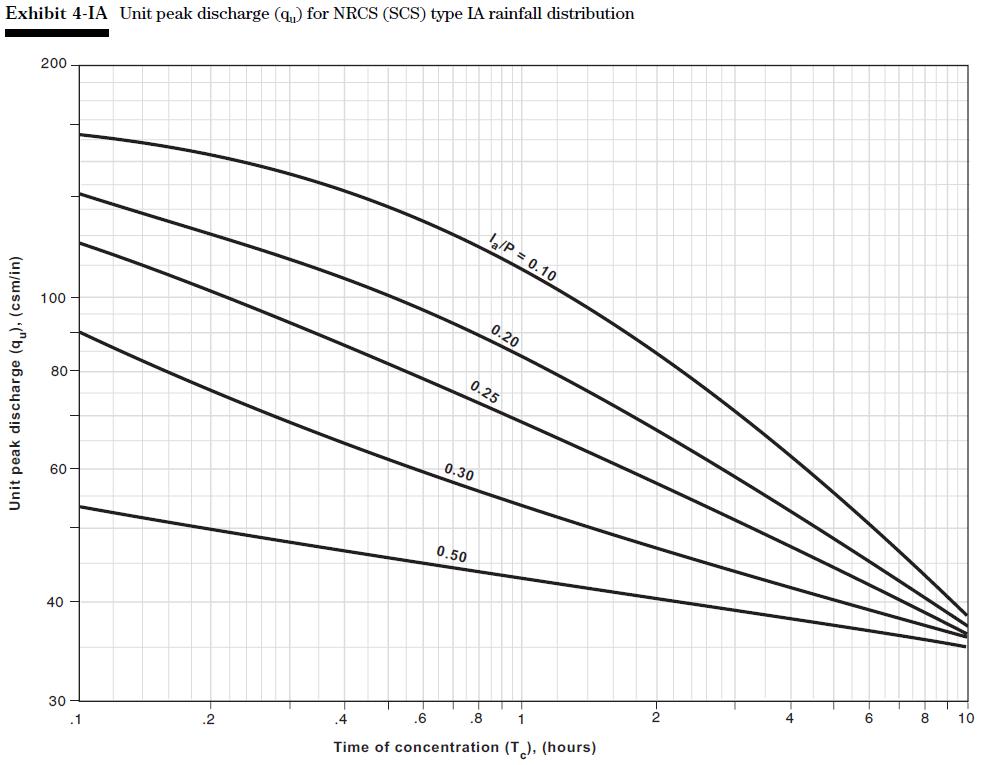
Exhibit 4-II from chapter 4 of TR-55 for Type II rainfall Distribution

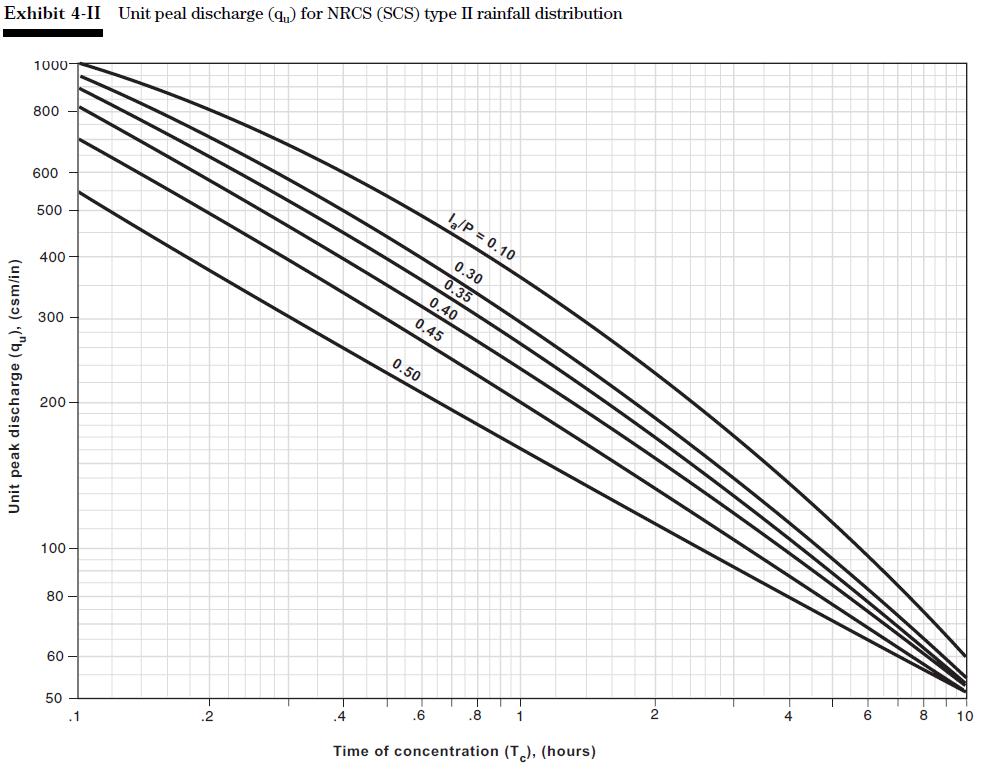
Exhibit 4-III from chapter 4 of TR-55 for Type III rainfall Distribution