Hypothesis Testing
The goal of statistical hypothesis testing is to determine that a claim made for a particular parameter of the population can be supported or rejected on the basis of information obtained from the sample data.
This method involves using the theory you learned from previous topics. However, it justifies introduction of some
definitions here:
- Null and Alternative hypothesis: When our goal is to support the claim made based on the information from the sample, the rejection of the claim is null hypothesis 'H0', and the claim itself is alternative hypothesis Ha. Some literature uses H1 to denote alternative hypothesis.
- Type I error: Rejecting H0 when H0 is true.
α is the probability of making type I error. - Type II error: Not rejecting H0 when H1 is true.
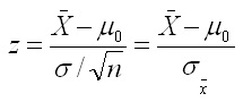
- Test Statistic: The random variable, such as 'z';, whose value we use to test the hypothesis.
One important tip is to remember that when you formulate hypothesis, always include equality sign (≤, =,
or ≥) into the null hypothesis H0. This means that your alternate hypothesis should include (<, ≠,
or >)sign.
The hypothesis testing could be one sided or two sided. One sided tests involves rejecting H0, if the
test statistic falls in the rejection region on one side of the normal distribution curve. Two sided test involves
rejecting H0, if the test statistic falls in the rejection region on either side of the normal curve.
Example:
A company XYZ wants to claim that it's weightloss program helps reduce on an average 20 lbs in 4 weeks. In the footprint it will state that the claim is based on the results from 50 participants losing an average of 22 lbs in 4 weeks of study period with the standard deviation of 7 lbs. You job as a statistician is to verify this claim with a 95% confidence level and endorse the claim. Would you endorse it ??
Solution: First, we need to formulate the hypothesis. The claim is that X (weightlost)>20. Therefore, our
job is to test if the information from study supports the claim or not.
The rejection of the claim is null hypothesis. Therefore, H0: µ = 20. Alternatively,
Ha:µ>20.
The sample size n = 50; α=0.05. The test statistic is Z and you want to check if it is greater than
Z0.05. If that's the case then, you can support the claim and reject H0.
From the normal distribution table, you found that Z0.05=1.645. Using the formula above, you found that:
Z=(22-20)/(7/√50)=2.02. Since this Z > Z0.05, you can reject H0 and endorse the claim!
