z-score
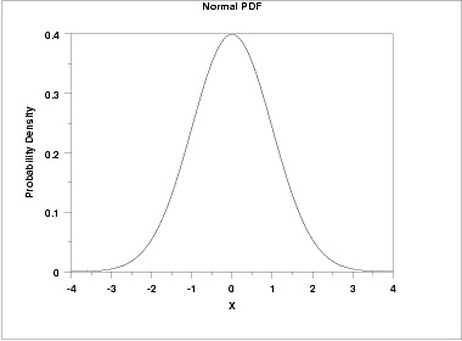
If we can standardize a Normal Curve such that it's mean is zero and it's standard deviation is one then we can use
it to easily standardize any normally distributed variable. Also it will provide us with a reference distribution
that we can use to compare two distributions with different mean and standard deviation. For this purpose, we will
use something called 'z-score'. z-score helps us transform the measured data value into the standardize normal curve
(or theoretical probability distribution). This conversion of data value to z-score does not change its underlying
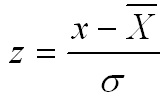
value. The formula for this conversion is:
Example: 1. Calculate whose income variation is more on an annual basis. (Use the data provided in following table).
Example 2. In 2011 Joe is expecting to earn USD 80000 and John is expecting to earn GBP 57000. Who has more chances of achieving their goal in 2011 - base your decision on z-score!?
| Year | 2006 | 2007 | 2008 | 2009 | 2010 |
|---|---|---|---|---|---|
| Joe-USD | 68000 | 72000 | 78000 | 65000 | 70000 |
| John-GBP | 45000 | 49000 | 41000 | 50000 | 51000 |
Answer: Since you have read so far, you cranked your calculator and found out that the mean income and standard
deviation for Joe's income over the past 5 years is USD 70,600 and USD 4363.4 respectively. You also found that
µ and σ for John's over the past 5 years is GBP 47,200 and GBP 3709.4 respectively. Also, to get
answer to first part, you calculated the coefficient of variation (CV) for Joe and John.
The CV for Joe is (4363.4*100/70,600)=6.18 and CV for John is (3709.4*100/47,200)=7.86. Therefore, John's income
varies more. (Note that if we made our decision solely based on comparison of σ, we would be wrong!!)
For part 2, you cannot compare the above figures and decide whose income expectation is more because the units (currency)
for Joe and John's income are different. Well, here comes the z-score to the rescue!
z-score for Joe's income: (80,000 - 70,600)/4363.4 = 2.15.
z-score for John's income: (57,000 - 47,200)/3709.4 = 2.64.
(Note that the z-score is dimensionless and therefore it provides us a reference to compare). As we can see that
z-score for John is higher than Joe, therefore probability of achieving his goal is less compared to Joe. Higher
the z-score, less is the probability of that data occurring !!.
